

Linux is down slightly after a peak month, but probably that month had Linux over-represented. This month we see English down a bit too, Chinese is up a little.
https://store.steampowered.com/hwsurvey/Steam-Hardware-Software-Survey-Welcome-to-Steam
https://www.gamingonlinux.com/steam-tracker/
I copied the data from gamingonlinux and put it into my own sheet with an exponential trendline (red) and a moving average line (green) to smooth out the variance of the survey. We’re definitely trending upwards.
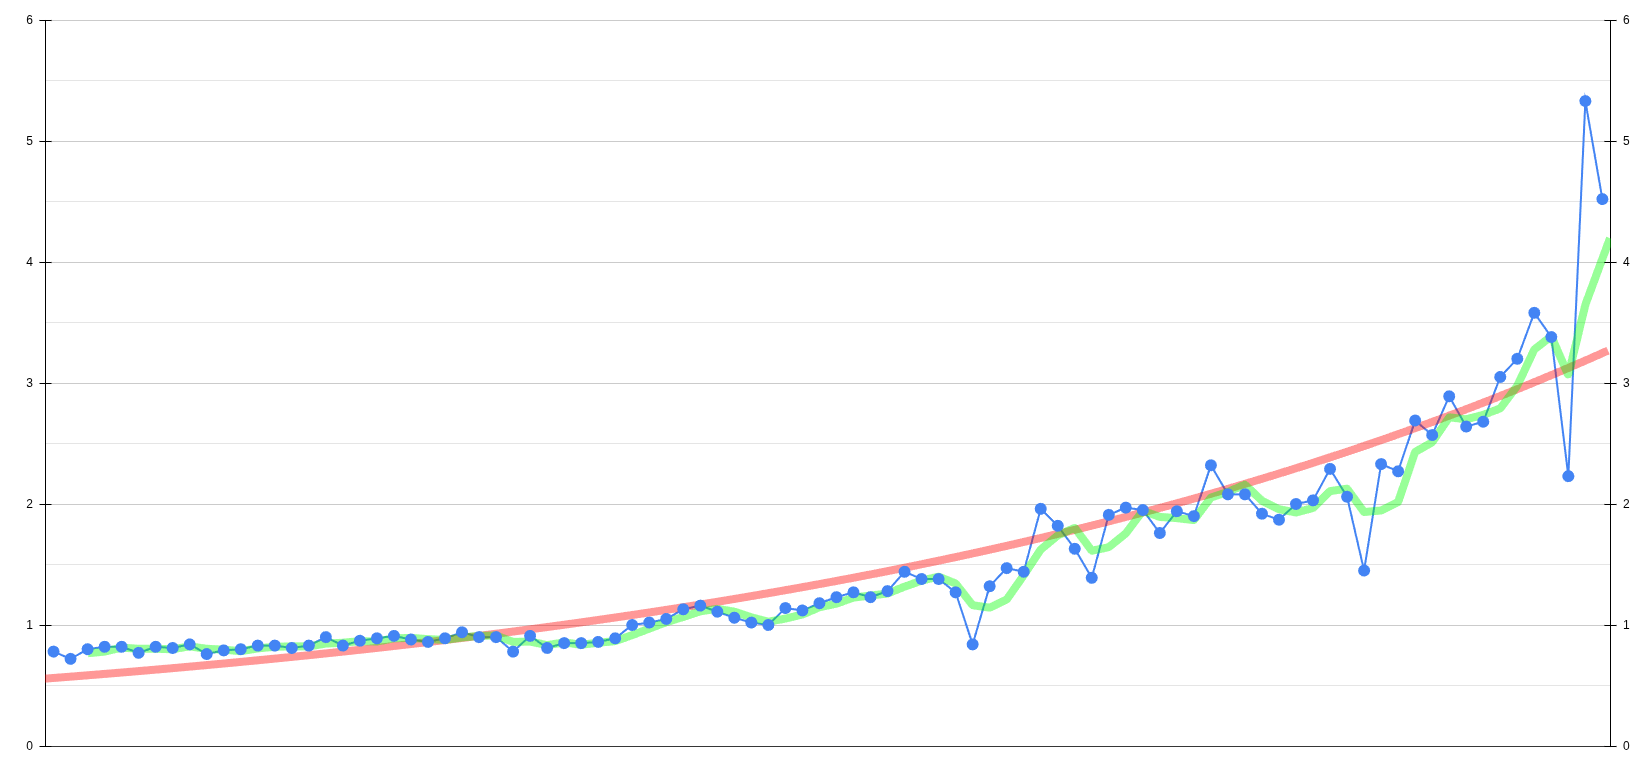
Here’s the csv data
0.78, 0.72, 0.80, 0.82, 0.82, 0.77, 0.82, 0.81, 0.84, 0.76, 0.79, 0.80, 0.83, 0.83, 0.81, 0.83, 0.90, 0.83, 0.87, 0.89, 0.91, 0.88, 0.86, 0.89, 0.94, 0.90, 0.90, 0.78, 0.91, 0.81, 0.85, 0.85, 0.86, 0.89, 1.00, 1.02, 1.05, 1.13, 1.16, 1.11, 1.06, 1.02, 1.00, 1.14, 1.12, 1.18, 1.23, 1.27, 1.23, 1.28, 1.44, 1.38, 1.38, 1.27, 0.84, 1.32, 1.47, 1.44, 1.96, 1.82, 1.63, 1.39, 1.91, 1.97, 1.95, 1.76, 1.94, 1.90, 2.32, 2.08, 2.08, 1.92, 1.87, 2.00, 2.03, 2.29, 2.06, 1.45, 2.33, 2.27, 2.69, 2.57, 2.89, 2.64, 2.68, 3.05, 3.20, 3.58, 3.38, 2.23, 5.33, 4.52
It seems that the lag period (pre-Steam Deck) is causing the exponential fit to not be that good. Can you try fitting only to data from the past 4 years to see if the fit is better?
Edit: Was easy enough for me to do, and I had the software to do it, so I did it.

Details:
Fitted entire dataset with a non-linear regression (minimizing sum of squares), with the given model:
Y = baseline + Y0 * exp(k*t)
Fitted equation was determined to be Y=0.7717 + 0.04451 * exp(0.04677 * t)
With this fit, doubling time is 14.82 months.
R^2 is 0.8851
95% CI:
baseline = 0.6029-0.9093
Y0 = 0.01744-0.1023
k = 0.03749-0.05734
Doubling time = 12.09-18.49
Edit 2: if we do a bit of the statistical funny, we can plug the equation into Desmos and try to extrapolate:

With this data, we can estimate that Linux usage will hit a solid 5% on Steam after ~97 months (most recent datapoint is month 91 in my dataset), which should correspond to ~November 2026. If we extrapolate farther into the future, we can estimate that Linux will hit 10% at ~114 months, which corresponds to ~March 2028
The year of the GNU/Linux desktop!
Probably tanh or logistical fit is better, and we’re in the early exponential phase of it.
I considered it, but we’re so early in the exponential rise that I didn’t think it would matter significantly unless you really wanted to do some future extrapolation
Yeah this is a good example of how to look at Steam’s hardware survey.
Valve has loads more data than they provide in the survey so they can correct the data to give themselves a much more accurate picture. We just get a monthly snapshot and in aggregate which only shows who happens to have completed the survey. So we can’t know the actual absolute numbers and we can’t match individual users together like Valve can - but we can see trends in each dataset.
The spiking up and down month to month for OS doesn’t matter, the overall trend is up for Linux. It can’t tell us actual numbers even using trends, but we can be confident Linux use has been trending up. And while Linux use remains low, it does look like it’s tripled or quadrupled in the past.
How much of that is Linux desktop vs Steam deck growth is harder to tell. But in some ways it doesn’t matter; even if Linux remains small as a proportion, that is still a lot of users which means the whole Linux gaming ecosystem is healthy.
Both february and march were outliers. Their average is consistent with the overall trend. Probably Valve messed something up.
There was a lot of variance with the Chinese New Year, as usual for this season
That means, Linux is dying! The Apocalypse!
What about the steam softer survey? (Think you might have a typo in that there title friend)
I prefer the steam “hardest” survey myself.
Luckily we can edit titles on Lemmy lol
I hope the trend continues. We could really benefit from greater adoption and more support from developers.
I like the chart and agree with the conclusion. But shouldn’t the exponential trend line start at the same percentage in the beginning of the chart? Right now, the exponential trend line is far below the original value at start, and with exponential lines that matters.
Might be a fitted to minimize the distance to all points. OP didn’t specify enough information though
It’s whatever Google Sheets does lol
Finally, year of the Windows desktop.
I wonder if there is any meaningful relationship between rate of Linux adoption and percentage of games people are actively playing being marked as Steam Deck ready?


